

Table of Contents
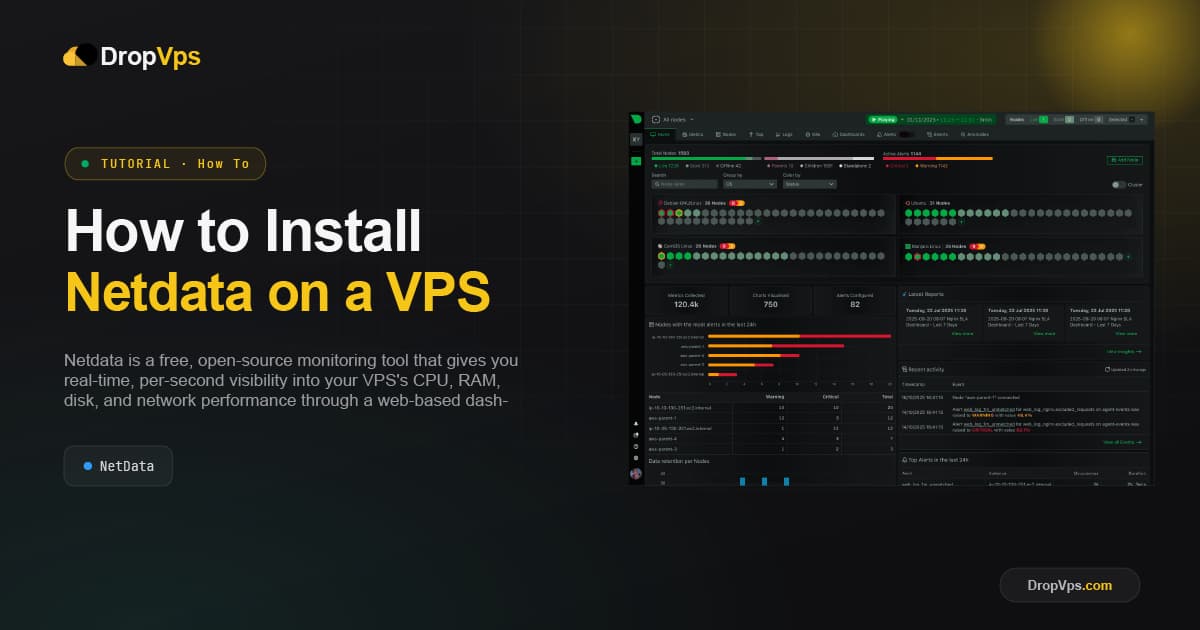
Netdata is a free, open-source monitoring tool that gives you real-time, per-second visibility into your VPS's CPU, RAM, disk, and network performance through a web-based dashboard.
Before starting, connect to your VPS via SSH with a user that has sudo privileges.
Step 1: Update the Server
Update your package list before installing anything new:
sudo apt update && sudo apt upgrade -yStep 2: Install Netdata Using the Official Script
Netdata provides an official one-line installer, called kickstart.sh, that automatically detects your Linux distribution, installs all required dependencies, and configures Netdata for you. Run:
wget -O /tmp/netdata-kickstart.sh https://get.netdata.cloud/kickstart.sh && sh /tmp/netdata-kickstart.shDuring installation, you'll be prompted to confirm the setup and optionally connect the VPS to Netdata Cloud for centralized monitoring. This step is optional, and Netdata works fully as a local dashboard without it.
The script installs all dependencies, creates the required system user, and configures Netdata automatically, so no manual setup is needed.
Step 3: Verify Netdata Is Running
Check that the Netdata service started successfully:
sudo systemctl status netdataIf it's not already running, start it with:
sudo systemctl start netdataTo make sure Netdata starts automatically on reboot:
sudo systemctl enable netdataStep 4: Open the Netdata Port in the Firewall
Netdata's dashboard runs on port 19999 by default. If your VPS uses UFW, allow access only from your own IP address to keep the dashboard private:
sudo ufw allow from YOUR_IP_ADDRESS to any port 19999Exposing port 19999 to the entire internet is not recommended, since the dashboard reveals detailed system information. Restricting access by IP keeps the setup secure.
Step 5: Access the Netdata Dashboard
Open a browser and go to your VPS IP address on port 19999:
http://your-vps-ip:19999The dashboard loads instantly and displays live, per-second metrics for CPU usage, memory, disk I/O, network traffic, and running processes, with no configuration required to start viewing data.
Netdata is a lightweight way to monitor a Linux VPS in real time, making it easier to spot resource spikes, diagnose performance issues, and keep track of server health as your workload grows.
Related Guide
Linux VPS Hosting PlansGet a Linux VPS with the resources needed to run Netdata and monitor your server in real time.
With Netdata installed, you now have a live, detailed view of your VPS's performance, updated every second, right from your browser.

Follow DropVPS on Google
Add DropVPS as a preferred source to see our latest VPS guides and tutorials surfaced first in Google Search and AI Overviews.
Need a Linux Server for This?
Run Debian, Ubuntu, or any Linux distro on DropVPS — fast NVMe SSD, full root access, and 24/7 support. Perfect for everything you just read.
- Full Root Access
- Debian & Ubuntu Ready
- 99.99% Uptime
- 24/7 Support
No commitment · Cancel anytime