

Table of Contents
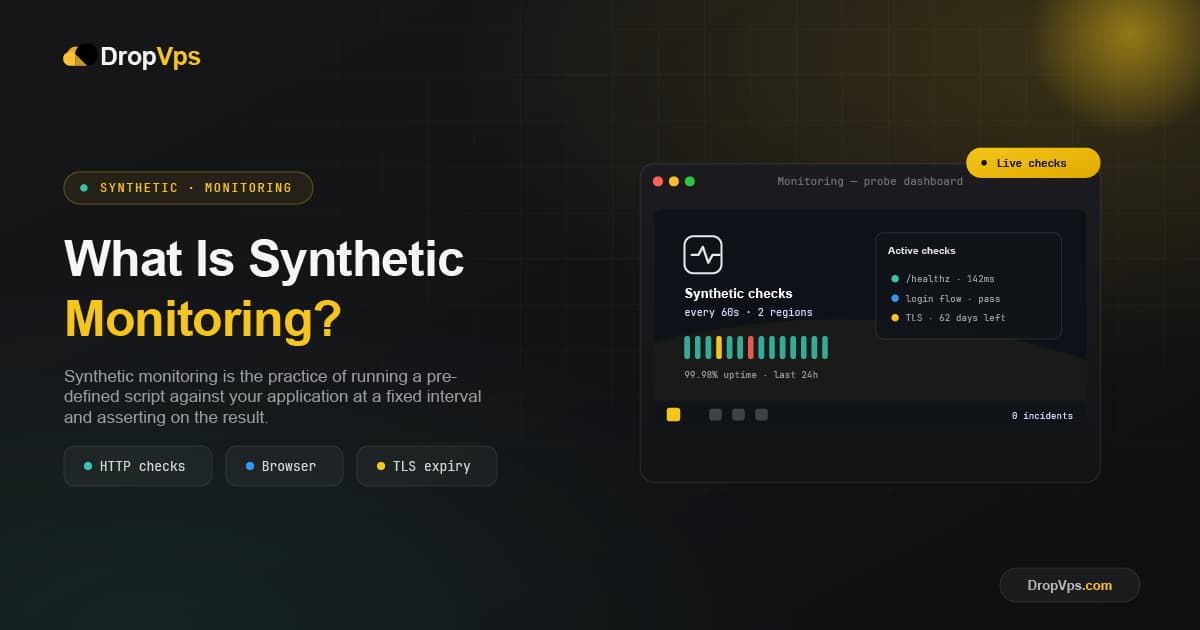
Synthetic monitoring is the practice of running a predefined script against your application at a fixed interval and asserting on the result.
A check has three parts. A trigger (every 60 seconds, from Frankfurt and Singapore). An action (send a GET request, or drive a headless browser through a login form). An assertion (status must be 200, response time must be under 800 ms, body must contain the word Dashboard).
If the assertion fails, you get an alert. That is the entire model.
The important part is where the check runs from. A synthetic probe lives outside your VPS — on a monitoring provider's network, or on a second small server you own. That means it tests the same path a real user takes: DNS resolution, routing, your firewall, the reverse proxy, TLS termination, the application, and the database behind it. If any link in that chain breaks, the check fails.
An agent running inside the VPS cannot do this. If the network interface goes down or the datacenter loses transit, the internal agent goes silent along with everything else.
Synthetic Monitoring vs. Uptime Checks vs. Real User Monitoring
Comparison of a simple uptime ping, a scripted synthetic check, and real user monitoring collecting data from live visitors
These three terms get used interchangeably and they are not the same thing.
Uptime monitoring is the simplest form: a request to one URL, checking only that the server answered. It answers "is the box reachable." It is a subset of synthetic monitoring, not a synonym for it.
Synthetic monitoring covers the whole spectrum from that single ping up to a scripted browser session that logs in, adds an item to a cart, and submits a payment form against a test account. The defining trait is that the traffic is scripted and scheduled, not that it is simple.
Real user monitoring (RUM) is the opposite approach. A JavaScript snippet in your pages reports actual visitor experience — page load times, JavaScript errors, Core Web Vitals — from real browsers on real connections.
The trade-off is coverage versus realism. RUM tells you what really happened, but only on pages people visited, and only after they hit the problem. Synthetic monitoring tells you about a path nobody happened to walk today, at 4 a.m., before your first customer of the morning finds it.
Production monitoring generally uses both. Synthetic catches breakage; RUM explains real-world performance.
The Types of Synthetic Checks
Four categories cover almost everything a VPS-hosted app needs.
HTTP / Availability Checks
A single request to a URL with assertions on status code, response time, and body content. Cheap enough to run every 30 seconds against every important endpoint.
Assert on body content, not just status. A misconfigured reverse proxy happily returns 200 OK with a default Nginx welcome page while your actual app is dead. A body assertion catches that; a status check does not.
API and Multi-Step Checks
A sequence of requests where later steps use data from earlier ones. Authenticate, capture the token, call a protected endpoint with it, assert on the JSON shape of the response.
This is where most real regressions surface. An API can return 200 while the payload silently lost a field after a deploy.
Browser Checks
A headless Chromium session driven by Playwright or Puppeteer that loads the page, executes JavaScript, clicks elements, and asserts on what renders. Slower and heavier than HTTP checks, so they run every 5 to 15 minutes rather than every 30 seconds.
Browser checks catch the class of failures that never touch your server logs: a broken JS bundle, a CDN asset returning 403, a third-party script blocking render.
Protocol and Certificate Checks
TCP port reachability, TLS certificate expiry, DNS resolution correctness, SMTP handshake for a mail server, ICMP for basic reachability.
The TLS expiry check is the highest-value, lowest-effort monitor you can run. A certificate that quietly fails to renew takes an entire site offline for every visitor at once, and it always happens on a weekend.
What to Monitor on a VPS-Hosted Application
Checklist of critical endpoints on a VPS application including health endpoint, login flow, payment API, TLS certificate, and background job heartbeat
Monitoring everything produces noise, and noisy alerts get muted. Start with the paths where failure costs you money or trust.
The health endpoint. Expose a route that actually touches your dependencies rather than returning a static string:
GET https://example.com/healthzA useful health endpoint queries the database, checks the cache connection, and returns 503 if either is unavailable. A health endpoint that returns OK unconditionally tells you only that the web process is alive, which you already knew.
The login flow. Authentication breaks in ways nothing else surfaces — an expired OAuth client secret, a session store that filled its disk, a clock skew rejecting tokens. Run this as a browser or multi-step API check against a dedicated monitoring account.
The revenue path. Checkout, signup, booking — whatever the one flow is that, if broken, means you are losing money every minute. Script it end to end with a test account.
TLS certificate expiry. Alert at 14 days remaining, not at expiry.
Background job heartbeat. Cron jobs and queue workers fail silently by design. Have the job hit a monitoring URL on each successful run, and alert when the ping does not arrive on schedule. This is inverted monitoring — the absence of a signal is the alert.
Third-party dependencies. If your app depends on a payment gateway or an external API, check it separately. When it goes down you want to know it is them and not you before you start reading your own logs.
Choosing Check Frequency and Locations
Frequency determines your detection window. A check every 5 minutes means an outage can run for nearly 5 minutes before you know about it.
A reasonable baseline: 30 to 60 seconds for the health endpoint and critical API routes, 5 minutes for secondary endpoints, 15 minutes for browser checks, once daily for certificate and DNS checks.
Do not alert on a single failure. One failed request is usually a transient network blip, not an outage. Require two or three consecutive failures before firing an alert — most tools call this a retry or confirmation threshold. Without it, you will get paged at 3 a.m. for a packet loss event that resolved itself in 20 seconds.
For locations, run checks from at least two geographic regions. A failure seen from one region and not another is a routing or CDN problem, not an application problem, and knowing that difference immediately saves you an hour of debugging. If your users are concentrated in Europe, probe from Europe; latency assertions written against a probe on the wrong continent will be meaningless.
Self-Hosted vs. Managed Synthetic Monitoring
Self-hosted synthetic monitoring on a separate VPS compared with a managed monitoring service running probes from multiple global regions
Both approaches work. They fail differently.
Self-hosted means running the monitoring stack yourself, typically on a small separate VPS. Uptime Kuma is the common starting point for HTTP, TCP, DNS, and certificate checks with a clean dashboard. Prometheus with the Blackbox Exporter covers the same ground and integrates with Grafana if you already run it. Playwright on a schedule handles browser checks.
You get unlimited checks for the cost of one small server and full control over the data. The cost is that you now operate the thing that is supposed to tell you when things break.
The non-negotiable rule for self-hosting: the monitoring server must not live on the VPS it monitors. If they share a host, a host failure takes down your app and your alerting at the same moment, and you find out from a customer. Put the monitor in a different datacenter, ideally with a different provider.
Managed services run probes from their own global network and handle the alerting infrastructure. You pay per check, and browser checks cost significantly more than HTTP checks. What you buy is genuine multi-region coverage and someone else's on-call rotation keeping the probes running.
A practical middle ground: run a self-hosted Uptime Kuma on a cheap Linux VPS in a second region for your broad coverage, and add a small managed plan for the two or three flows that matter most. You get redundancy on the monitoring layer itself, which is the point of the exercise.
Related Guide
Linux VPS Hosting for Monitoring WorkloadsA small Linux VPS in a second region is enough to run a self-hosted probe stack that stays up when your main server does not.
Sizing the Monitoring Server
Synthetic monitoring is light until browser checks enter the picture.
For HTTP, TCP, DNS, and certificate checks with Uptime Kuma, 1 vCPU and 1 GB RAM handles a few hundred monitors comfortably. The workload is mostly idle waiting on network I/O.
Browser checks change the math. Each headless Chromium instance wants roughly 300 to 500 MB of RAM while running. Two or three concurrent browser checks put you at 2 GB minimum, and 4 GB is the number to plan for if browser checks are a core part of your setup.
Disk matters if you retain screenshots or video traces from failed browser runs. Set a retention policy on day one; trace artifacts fill a disk faster than logs do.
Writing Assertions That Catch Real Failures
The quality of a synthetic check is entirely in its assertions. A weak assertion produces a green dashboard during an outage.
Assert on content, not just status. Check that the response body contains a string only your working application produces — a username on a dashboard, a product name on a catalogue page.
Assert on response time separately from availability. A 200 that took 9 seconds is a failure your users experience as one, even though the status code says otherwise. Set the threshold from your real p95 latency, not from a round number you picked.
Assert on the shape of API responses. Check that the JSON contains the expected keys, not merely that it parsed. A deploy that renames a field returns valid JSON and a 200 status while breaking every client.
Use a dedicated monitoring account for anything requiring authentication. Never use a real customer account or a live payment method. Give the account only the permissions the check needs, and expect its actions to show up in your analytics — exclude it by user agent or account ID so it does not pollute your numbers.
Point checks at production. Staging tells you the code works; it does not tell you the production certificate, DNS, firewall rules, or environment variables are correct, and that is where most incidents actually originate.
Turning Alerts Into Something Useful
A monitor that pages you without telling you anything is a worse version of a customer email.
Route alerts by severity. Health endpoint and revenue path failures go to a channel that wakes someone. Certificate expiry at 14 days goes to email. Response time degradation goes to a dashboard, not a phone.
Include the failing assertion in the alert text. "Login check failed: expected body to contain 'Dashboard', got HTTP 502" is actionable. "Check failed" is not.
Track how often each alert turns out to be nothing. Any check that fires false positives more than occasionally needs its threshold or retry count adjusted, or it needs to be deleted. A muted alert channel is worse than no monitoring at all, because it gives you the feeling of coverage without the coverage.
Synthetic monitoring is not a replacement for server metrics or logs. It is the layer that tells you a user-visible thing broke, and roughly where in the chain, so the metrics and logs you already collect have somewhere to point. Start with a health endpoint check and a certificate expiry check on your most important service, get the alerting routed correctly, then expand from there.

Follow DropVPS on Google
Add DropVPS as a preferred source to see our latest VPS guides and tutorials surfaced first in Google Search and AI Overviews.
Need a Linux Server for This?
Run Debian, Ubuntu, or any Linux distro on DropVPS — fast NVMe SSD, full root access, and 24/7 support. Perfect for everything you just read.
- Full Root Access
- Debian & Ubuntu Ready
- 99.99% Uptime
- 24/7 Support
No commitment · Cancel anytime